AI for Data Analysis: Your Beginner’s Guide
AI for Data Analysis is changing how we interpret data, and you don’t need to be a data scientist to use it. If you’ve ever felt overwhelmed by spreadsheets, struggled to spot patterns in numbers, or wondered how businesses make data-driven decisions, artificial intelligence can be your new best friend. This guide walks you through everything you need to know about using AI for data analysis, from understanding the basics to implementing practical solutions in your daily life or work.
What ‘s AI for Data Analysis?
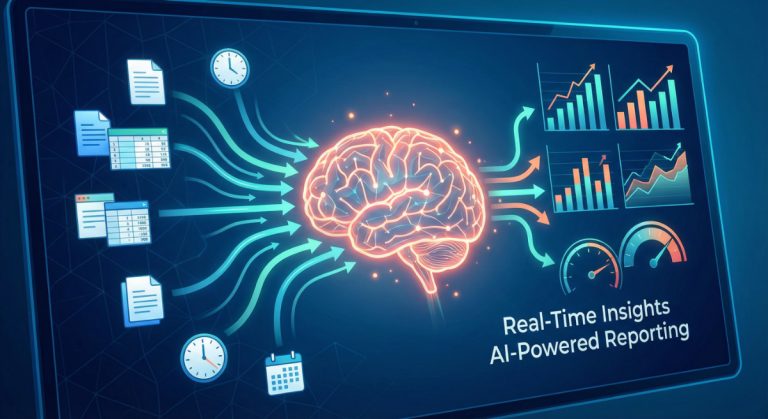
AI for data analysis refers to using artificial intelligence technologies to examine, clean, interpret, and visualize data automatically. Instead of manually sorting through rows and columns, AI algorithms can process massive amounts of information in seconds, identify patterns humans might miss, and present findings in easy-to-understand formats.
Think of it as having a tireless assistant who never gets bored counting numbers, always spots inconsistencies, and can predict trends based on historical patterns. Whether you’re tracking sales figures, monitoring social media engagement, or analyzing customer feedback, AI-powered tools handle the heavy lifting while you focus on making informed decisions.
The beauty of modern AI data analysis tools is their accessibility. You no longer need programming knowledge or statistical expertise to leverage these powerful technologies. Many platforms now offer intuitive interfaces where you simply upload your data and ask questions in plain English.
Why AI for Data Analysis Matters
Traditional data analysis required specialized skills, expensive software, and countless hours of manual work. Machine learning for data insights has changed this landscape completely. According to recent industry reports, businesses using AI-driven analytics see decision-making speed increase by up to 5 times compared to traditional methods.
This democratization of data analysis makes it possible for individuals and small businesses to compete with bigger companies. A freelancer can now analyze client trends just as effectively as a corporation with a full analytics team. Students can process research data that would have taken weeks in just hours.
The real power lies in AI’s ability to uncover hidden relationships in your data. Perhaps your best-selling product isn’t what you thought, or customer complaints spike on specific days for reasons that aren’t obvious. AI tools surface these insights automatically, helping you make smarter decisions faster.
How AI Analyzes Data: The Basics
Understanding how artificial intelligence processes data doesn’t require a computer science degree. Here’s what happens behind the scenes in simple terms:
Data Collection and Preparation: AI systems first gather your data from various sources—spreadsheets, databases, or even live feeds. They then clean this information, removing duplicates and fixing errors that could skew results.
Pattern Recognition: Using algorithms trained on millions of examples, AI identifies patterns, correlations, and anomalies in your dataset. This is where machine learning algorithms shine, recognizing relationships that aren’t immediately visible to human analysts.
Predictive Analysis: Based on historical patterns, AI can forecast future trends. If your sales typically increase 15% before holidays, the system learns this pattern and predicts similar behavior for upcoming seasons.
Visualization: Finally, AI transforms complex findings into charts, graphs, and dashboards that make sense at a glance. Instead of staring at rows of numbers, you see clear visual representations of what your data means.
Step-by-Step Guide: Getting Started with AI for Data Analysis
Step 1: Define Your Goals
Before diving into tools, clarify what you want to learn from your data. Are you trying to understand customer behavior? Optimize inventory? Track project progress? Clear objectives guide which AI analysis tools will serve you best.
Write down specific questions you want answered. Instead of “I want to understand my sales,” try “Which products sell best on weekends?” or “What factors lead customers to abandon their carts?” Specific questions yield actionable insights.
Step 2: Organize Your Data
AI works best with clean, structured information. Gather your data into a single location—usually a spreadsheet or CSV file. Ensure consistent formatting: dates in one format, numbers without extra characters, and clear column headers.
Don’t worry if your data isn’t perfect. Many AI-powered analytics platforms include cleaning features that automatically detect and fix common issues. However, starting with organized information accelerates the process significantly.
Step 3: Choose the Right AI Tool
For beginners, start with user-friendly platforms that don’t require coding. Tools like Google Cloud AutoML, Microsoft Power BI with AI features, or Tableau offer intuitive interfaces where you can upload data and generate insights through simple clicks.
If you’re working with text data like customer reviews or survey responses, specialized natural language processing tools like MonkeyLearn or Lexalytics can analyze sentiment and extract themes automatically.
For financial or business data, platforms like Zoho Analytics or Domo provide pre-built templates that understand common business metrics, making setup even faster.
Step 4: Upload and Explore
Once you’ve selected a platform, upload your dataset. Most tools guide you through this process with clear instructions. After uploading, spend time exploring the interface—most platforms offer sample analyses to familiarize yourself with features.
Try the auto-analysis features many platforms offer. These AI-driven functions automatically suggest intriguing patterns or unusual findings in your data, giving you starting points for more profound investigation.
Step 5: Ask Questions
Modern AI analytics tools often include natural language query features. Simply type questions like “What were my top 5 products last quarter?” or “Show me customer satisfaction trends over time.” The AI interprets your question and generates relevant visualizations.
Experiment with different question phrasings. If one query doesn’t return useful results, rephrase it. AI systems learn from context, so adding details like time ranges or specific categories improves accuracy.
Step 6: Interpret and Act on Insights
When AI presents findings, take time to understand what they mean for your specific situation. A correlation between two variables doesn’t automatically mean one causes the other—context matters.
Look for actionable patterns. If data shows customers from a specific region have higher return rates, investigate why. Perhaps shipping takes too long, or product descriptions aren’t clear. Data-driven insights only create value when you act on them.
Step 7: Set Up Ongoing Monitoring
Many AI platforms let you create dashboards that update automatically as new data arrives. Set up monitoring for your key metrics so you stay informed without manual updates.
Configure alerts for important thresholds. If inventory drops below certain levels or customer complaints spike, automatic notifications help you respond quickly rather than discovering issues during scheduled reviews.

Common Mistakes Beginners Make (And How to Avoid Them)
Mistake 1: Uploading Messy Data Many beginners rush to upload data without basic cleanup. This leads to inaccurate results and wasted time. Spend 10 minutes organizing your spreadsheet before uploading—ensure dates are formatted consistently, remove empty rows, and verify numbers don’t include text characters.
Mistake 2: Ignoring Data Context AI might show that ice cream sales correlate with drowning incidents, but that doesn’t mean ice cream causes drowning. Both increased in the summer. Always consider external factors and domain knowledge when interpreting AI-generated insights.
Mistake 3: Over-Relying on Automation While AI handles heavy lifting, human judgment remains essential. Review suggestions critically. If an AI recommends discontinuing a product that’s strategically important or has seasonal patterns, your business knowledge should override the algorithm.
Mistake 4: Not Starting Small Trying to analyze every data point from day one overwhelms beginners. Start with one specific question and a manageable dataset. Once comfortable, gradually expand to more complex analyses.
Mistake 5: Forgetting Privacy Considerations When analyzing customer data, always ensure you’re complying with privacy regulations like GDPR or CCPA. Remove personally identifiable information before uploading data to cloud-based AI platforms unless you’ve verified their security certifications.
Popular AI Tools for Data Analysis
Google Cloud AutoML: Perfect for beginners who want powerful analysis without coding. Upload datasets and let Google’s AI automatically build custom models for your specific data type.
Microsoft Power BI with Copilot: Combines traditional business intelligence with AI assistance. Ask questions in natural language and receive instant visualizations. Integrates seamlessly with Excel, making the transition easy for spreadsheet users.
Tableau with Einstein Discovery: Offers a drag-and-drop interface for creating stunning visualizations. The Einstein AI feature automatically discovers patterns and suggests relevant questions you should ask about your data.
MonkeyLearn: Specializes in text analysis using natural language processing. Excellent for analyzing customer reviews, survey responses, or social media comments to understand sentiment and extract key themes.
Akkio: Designed specifically for beginners and small businesses. Claims to deliver predictions and insights within minutes of uploading data, with no technical expertise required.
Real-World Applications of AI for Data Analysis
Small Business Inventory Optimization: A boutique owner uploads sales data and discovers that certain items sell significantly better when paired together. The AI suggests bundling strategies that increase average transaction value by 23%.
Freelance Productivity Tracking: A freelance designer analyzes project completion times and identifies that design work completed in morning hours receives 40% fewer revision requests than afternoon work, leading to schedule optimization.
Student Academic Performance: A college student tracks study hours, sleep patterns, and test scores. AI analysis reveals that study sessions under 90 minutes with 15-minute breaks yield better results than marathon sessions, transforming study habits.
Non-Profit Donation Patterns: A small charity analyzes donor behavior and discovers that email campaigns sent on Tuesdays generate 35% higher response rates than other days, optimizing outreach timing.
Content Creator Engagement: A blogger uploads metrics across posts and learns that articles between 1,800-2,200 words with at least 3 visuals generate twice the engagement of shorter or longer pieces, guiding content strategy.
Frequently Asked Questions About AI for Data Analysis
Next Steps: Your AI Data Analysis Journey
Now that you understand the fundamentals of AI for data analysis, it’s time to take action. Start by identifying one dataset you currently have—maybe customer records, personal finance tracking, or project timelines. Choose one specific question you want to answer about that data.
Next, sign up for a free trial of a beginner-friendly platform. I recommend starting with Google Cloud AutoML or Microsoft Power BI, as both offer generous free tiers and extensive tutorials. Spend an hour exploring the interface without pressure to produce perfect results.
Upload your small dataset and experiment with the auto-analysis features. See what patterns the AI discovers. Some findings might seem obvious, while others could genuinely surprise you. Both outcomes are valuable—confirmation validates your intuition, while surprises open new avenues for exploration.
As you grow comfortable, gradually tackle more complex questions. Join online communities where other beginners share experiences and solutions. The AI data analysis community is remarkably supportive, with countless free resources available.
Remember that every expert started exactly where you are now. The difference between beginners and advanced users isn’t innate talent—it’s simply practice and persistence. Each dataset you analyze builds your skills and confidence.
The power to transform raw numbers into actionable insights is now at your fingertips. Whether you’re optimizing a small business, advancing your career, or simply making better personal decisions, AI makes sophisticated data analysis accessible to everyone. Take that first step today—you might be amazed at what your data reveals.
References
- McKinsey & Company – “The State of AI in 2025: Agents, Innovation, and Transformation” (November 2025)
- Report URL: https://www.mckinsey.com/capabilities/quantumblack/our-insights/the-state-of-ai
- Key finding cited: 88% of organizations now use AI in at least one business function, up from 78% in 2024
- Survey methodology: 1,993 respondents across 105 countries, June-July 2025
- Gartner, Inc. – “Top Trends in Data and Analytics for 2025” (March 2025)
- Press release: https://www.gartner.com/en/newsroom/press-releases/2025-03-05-gartner-identifies-top-trends-in-data-and-analytics-for-2025
- Key insight: AI-driven agentic analytics transforming data analysis by automating closed-loop business outcomes
- Conference presentation: Gartner Data & Analytics Summit, Orlando, March 2025
- “Anthropic – “Anthropic Economic Index Report: Uneven Geographic and Enterprise AI Adoption” (September 2025)
- Report URL: https://www.anthropic.com/research/anthropic-economic-index-september-2025-report
- Data source: 1 million Claude.ai conversations analyzed from August 2025
- Key finding: AI usage clusters in coding and data analysis tasks
- Stanford HAI (Human-Centered Artificial Intelligence) – “The 2025 AI Index Report” (April 2025)
- Report page: https://hai.stanford.edu/ai-index/2025-ai-index-report
- Comprehensive data-driven view of artificial intelligence trends and adoption
- Annual benchmark report tracking AI development globally
- MIT Sloan Management Review – “Five Trends in AI and Data Science for 2025” by Thomas H. Davenport and Randy Bean
- Article URL: https://sloanreview.mit.edu/article/five-trends-in-ai-and-data-science-for-2025/
- Source: 2025 AI & Data Leadership Executive Benchmark Survey
- Key finding: 58% of organizations report achieving exponential productivity gains from AI

About the Author
Abir Benali is a friendly technology writer specializing in making AI accessible to non-technical users. With a passion for demystifying complex technologies, Abir creates practical guides that empower beginners to confidently explore AI tools. When not writing about technology, Abir enjoys helping small businesses leverage data to make smarter decisions and teaches introductory AI workshops in the local community. This article represents Abir’s commitment to making powerful technologies available to everyone, regardless of technical background.